Guide to Cyber Trend Data
Track your Cyber KPI's over time
In the Cyber Trend Data module you can view the current scores and history of the CyberScore, CyberThreat and CyberCompliance KPI's.
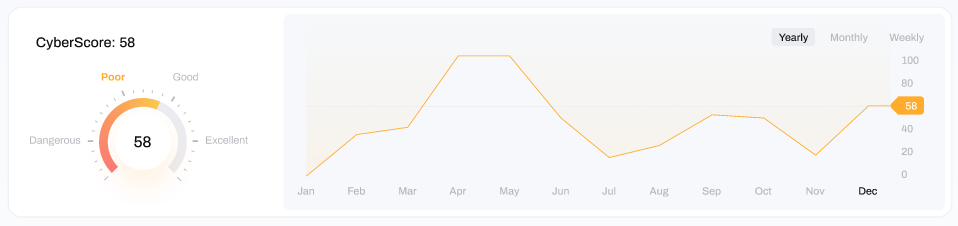
CyberScore
At the top of Cyber Trend Data window, you can see your current and previous CyberScore,
- On the left-hand side you can see your average CyberScore, which is an average for the period selected on the top right. This average CyberScore is also given a classification of either Dangerous, Poor, Good or Excellent.
- On the right-hand side you can see a graphical depiction of the history of your CyberScore over the selected time period. You can use this visual to track how your CyberScore has trended over time, enabling you to (hopefully) track your progress over time.
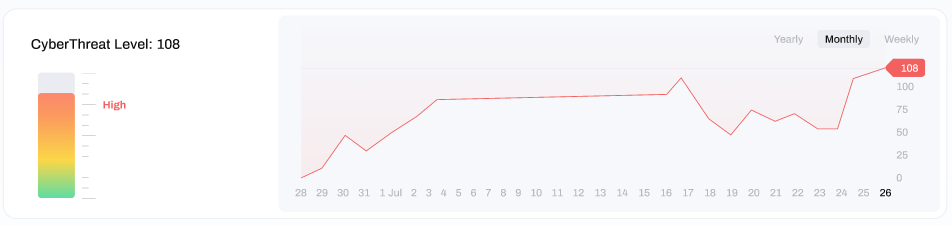
CyberThreat
In the middle of the Cyber Trend Data window, you can see your current and previous CyberThreat Level.
- On the left-hand side you can see your average CyberThreat Level, which is an average for the period selected on the top right. This average CyberThreat Level is also given a classification of either None, Low, Moderate, High or Critical.
- On the right-hand side you can see a graphical depiction of the history of your CyberScore over the selected time period. You can use this visual to track how your CyberScore has trended over time, enabling you to (hopefully) track your progress over time.
If you would like a more detailed understanding of your CyberThreat Level, including how it is calculated and how to improve it - go to this article.
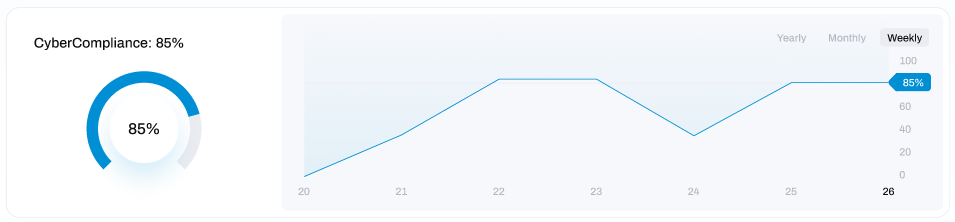
CyberCompliance
At the bottom of the Cyber Trend Data window, you can see your current and previous CyberCompliance Level.
- On the left-hand side you can see your average CyberCompliance score, which is an average for the period selected on the top right. This average CyberCompliance score is also given a classification of either None, Low, Moderate, High or Critical.
- On the right-hand side you can see a graphical depiction of the history of your CyberCompliance score over the selected time period. You can use this visual to track how your CyberCompliance has trended over time, enabling you to (hopefully) track your progress over time.
If you would like a more detailed understanding of your CyberCompliance, including how it is calculated and how to improve it - go to this article.