Guide to the Technical Drilldown
View your data that is driving your CyberScore, CyberThreat Level and CyberCompliance KPIs.
The Technical Drilldown module lists the various technologies for which you can connect your tools and view the data that will drive your cyber security KPIs in HighGround. Clicking into any of these will provide an overview of the data synchronized with your integrated tool. This is a convenient way to view the data from your Cyber tools all in the one place without having to login to the various tools you use to protect your organisation.
What's the difference between a Technology and a Tool?
In the Integrations menu, you can see both technologies and tools.
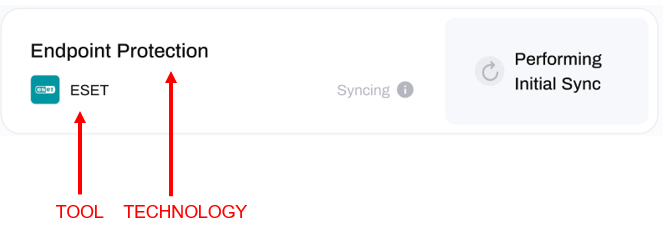
Technologies perform a specific function, and fulfil a particular form of protection within cyber security. For each technology, their may be many tools which achieve that form of protection.
For example; Email Filtering is a technology concerned with the analysis of inbound and outbound emails for suspicious content. Tools which provide Email Filtering technology include Vipre and SpamTitan.
The technologies listed under Integrations are:
- Patch Management
- Email Filtering
- Web Filtering
- Phishing Training
- Incident Response
- Endpoint Protection
- SIEM/IDS
- Dark Web Monitoring
- Vulnerability Management
Clicking into any of these will show you the tools that are available for that specific technology.
If you want to know more about each technology in the Technical Drilldown, and how to understand the tool's data, select the technology from the tabs below to learn more:
Patch Management
What is Patch Management?
Patch Management is essential for keeping your Operating System (OS) and the software used by your devices up-to-date. Tools for patch management monitor for outdated software and automate the process of deploying updates on a continual basis. Keeping your software up-to-date with the latest patches is critical to your organisation's security as patches are intended to provide defences against known vulnerabilities found within software. Such vulnerabilities are often publicly documented and easily exploited, providing entry points for hackers to compromise your IT systems.
Understanding your Tool's Data:
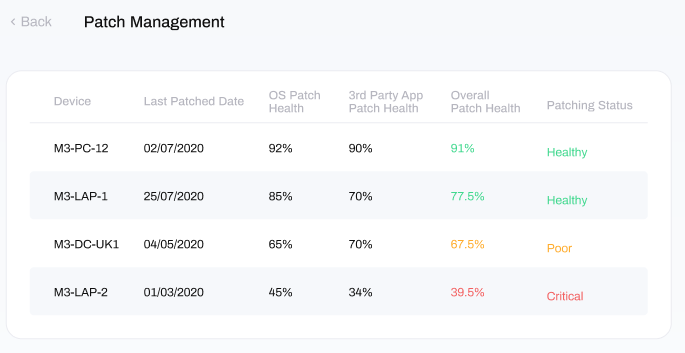
Clicking into your Patch Management tool will provide an overview of the 'Patch Health' of your individual devices, ordered as follows:
Device: this is the name of the device
Last Patched Date: the last time the device was patched by your connected tool
OS Patch Health: patch percentage of the devices operating system
3rd Party App Patch Health: patch percentage of 3rd party applications installed on the device
Overall Patch Health: overall patch percentage for the device, combining both operating system and 3rd party patching
Patching Status: a descriptive summary of the devices patch health, which is either Healthy, Poor or Critical.
Email Filtering
What is Email Filtering?
Email filtering is one of the most critical components of an organisations cyber security defences. Over 50% of all cyber attacks are delivered by email, so filtering your email both inbound and outbound malware, viruses, phishing, impersonation and spam is vital. Email filtering tools block or quarantine the vast majority of suspicious and dangerous emails before they present a danger to you. Simply put, you can't do without it!
Understanding your Tool's Data:
Clicking into your Email Filtering tool will provide you with an overview of the tool's data.
The history of your email filtering data is expressed as graphical and quantitative representations over a specified period of time.
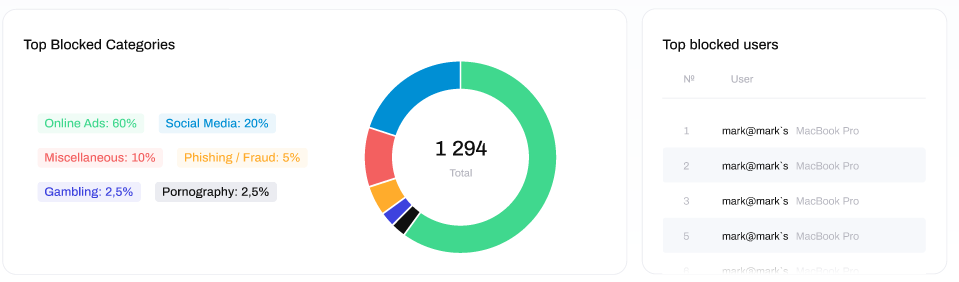
In the top-left of the window, you can view a pie chart depicting the percentage of filtered emails by category:
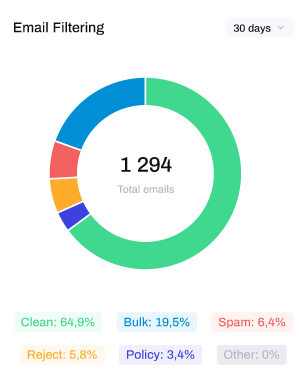
The categories of emails are as follows;
Clean: emails containing no suspicious content.
Spam: emails also known as 'junk' that were unsolicited, typically sent in bulk for the purposes of advertising or phishing.
Virus: emails containing a form of malware known as a virus which is usually enclosed in an attachment or delivered via a link.
Reject: emails that were rejected in protocol due to a high confidence that the email or the sender was dangerous
Policy: emails marked as non-compliant with email policy, such as mail that has failed SPF and DKIM checks, appear to be impersonation attempts or triggered keywords for common or trending attack types.
Other: emails that were not delivered and do not align with any of the previous categories.
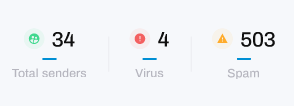
Below the pie chart is the number of total email senders, the number of viruses detected and the number of spam emails detected by the filtering tool over the specified time period:
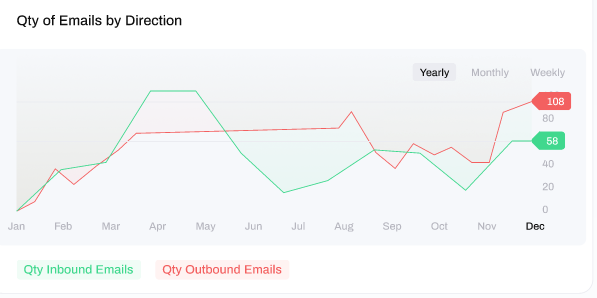
At the top-right of the window you can view a line graph depicting a comparison of the number of inbound vs outbound emails, which can be sorted by a Yearly, Monthly or Weekly view.
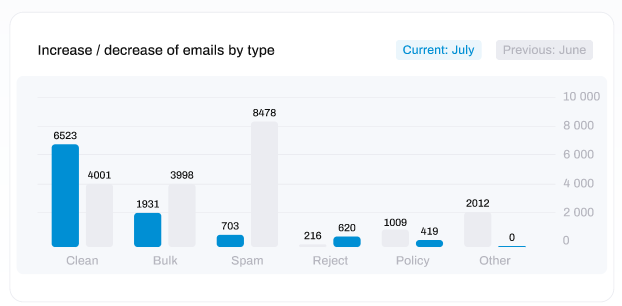
Below this, a bar chart displays a comparison on the quantity of emails by category of filtered email from the previous month versus the current month.
Web Filtering
What is Web filtering?
Also known as Content Filtering, Internet Filtering or DNS Filtering, Web Filtering is necessary for sanitizing the internet traffic which enters or exits your network or devices. Whilst many think that this is unnecessary because they trust their users to not access inappropriate content, malicious actors are able to gain a foothold and execute within organisations IT systems due to the lack of Web Filtering. This is because many of the dangerous URLs and IP addresses which malware 'calls home' to / communicates with, will be detected and blocked by Web Filtering technology due to conditions such as poor reputation, suspicious categories or the collective intelligence of cyber security providers sharing the latest threat data with one another for the benefit of their users.
Understanding your Tool's Data:
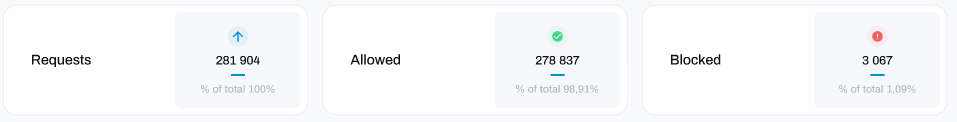
Clicking into the Web Filtering tool will provide you with an overview of the tools data. Data is displayed for:
Requests: the total number of URLs / IP address 'Requests' originating from your network and devices
Allowed: the total number of URLs / IP address requests that were allowed to be accessed
Blocked: the total number of URLs / IP address requests that were blocked from being accessed
% of total xx.xx%: the percentage of the overall number of requests
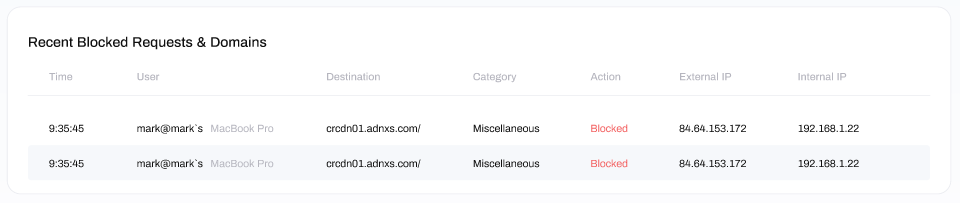
The column below that displays the Recent Blocked Requests & Domains. This contains the most recently blocked websites and IP addresses that were blocked from being accessed. Data is displayed for:
Time: the time of the blocked request
User: the user or device from which the blocked request originated from (if known)
Destination: the destination (URL only) of the blocked request.
Category: the category the domain or ip address which was blocked has been classified under
Action: the action on the request, which will always be 'blocked'
External IP: the External (WAN) IP of the destination endpoint for the request
Internal IP: the Internal (LAN) IP address from which the request originated from
Phishing Training
What is Phishing Training?
Bad Actors (aka hackers) rely on a number of Tools, Tactics and Techniques (TTPs) to compromise your organisation, and one of their favourites is to target your employees directly. Everyone in the organisation is a potential target no matter how senior, intelligent or 'IT savvy' they are. In fact, the more senior you are in an organisation, the more likely you are to be targeted by a sophisticated attack such as Whaling or Spear-phishing and Sextortion.
Phishing training, also known as Security Awareness Training, is an excellent way of testing and training your users to recognise suspicious or malicious emails. Training your employees to carefully analyse emails and spot common (but effective) phishing techniques such as malicious attachments and dangerous links, is highly effective in reducing your organisations risk. Tools for Phishing Training typically involve 'phishing campaigns', in which employees are sent test emails containing a suspicious link or attachment simulating those of a phishing attempt. Employees who click on the links or open the attachments 'fail' the test and auto-enrolled into online training on how to identify phishing emails. Alternatively, separate training campaigns can be run for all users separately to the phishing tests, to create a culture of continual training and awareness regardless of performance on these tests.
Understanding your Tool's Data:
Clicking into your Phishing Training tool will provide you with an overview of the tool's data.
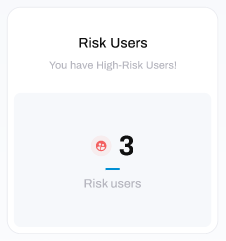
At the top-left of the window you can see the number of high-risk users who have failed the phishing campaigns by clicking on the suspicious link. These are users who have been identified as having continued to fail phishing tests, or disengaged with phishing training, on an ongoing basis:
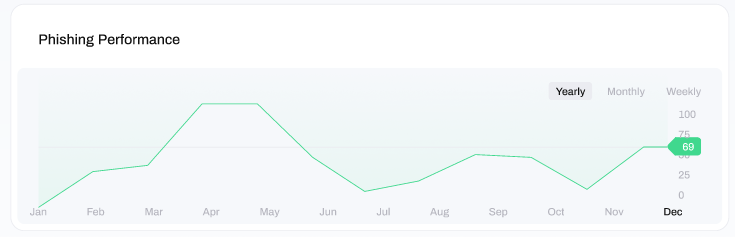
At the top-right of the window you can view a line graph depicting the phishing test performance. A high score (towards max 100) represents that less users have failed the phishing tests and therefore the performance of users in identifying dangerous emails is good. In contrast, a low score (towards min 0) represents that more users have failed the phishing tests and therefore the performance of users in identifying dangerous emails is poor.
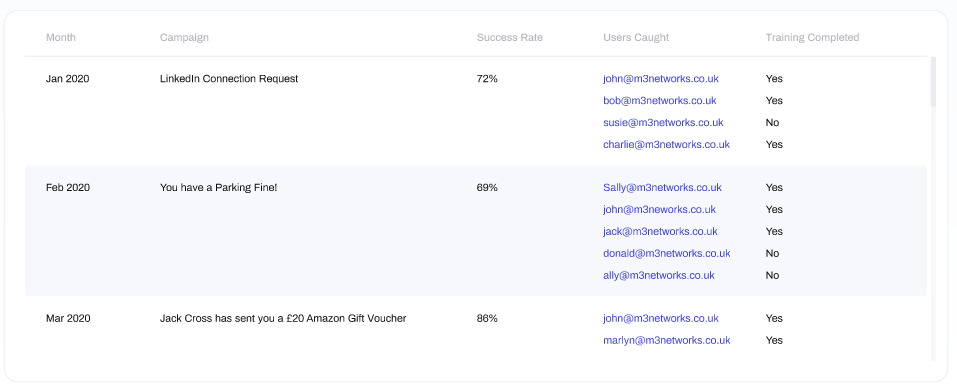
At the bottom of the window you can view the results of your previous phishing campaigns, summarised by the overall success rate (the percentage of users who passed the test) and the email addresses of the users who failed the test.
- Month: the month which the campaign started
- Campaign: the name given to the campaign by the user who created it (often descriptive of the email itself)
- Success Rate: the performance of users in the campaign (as above) - with 100% meaning that nobody failed the phishing test, and 0 indicating that all users failed the phishing test
- Users Caught: a list of email addresses of users who failed the phishing test
- Training Completed: confirmation of whether the user completed the training they were automatically enrolled in after failing the phishing test
External Network Scan
What is an External Network Scan:
External Network Scans are a vulnerability assessment against your external network (typically your Routers and/or Firewalls) to detect any exploitable vulnerabilities or open ports which are vulnerable to brute-force attacks over the internet.
Understanding your Tool's Data:
Clicking into your External Network Scan tool will provide you with an overview of the tool's data.
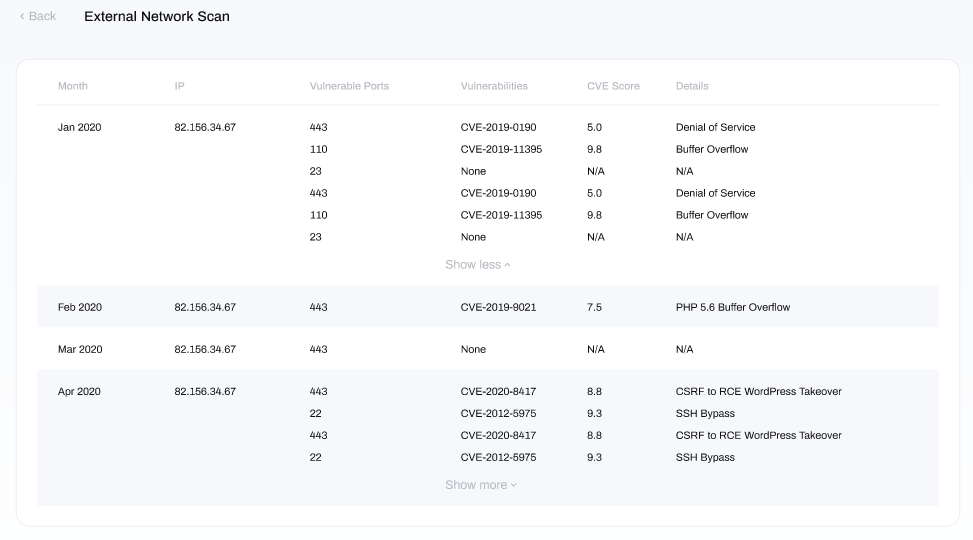
In this window you will see a summary of results from previous scans, separated by the following columns:
- Month: the month and year the scan was conducted.
- IP: the WAN IP address being scanned for vulnerabilities or vulnerable ports.
- Vulnerable Ports: ports that the scan found to be open and which are commonly targeted by bad actors (aka hackers) via attack vectors such as Brute Forcing, Buffer Overflow, DoS, DDoS and Information Gathering.
- Vulnerabilities: known vulnerabilities for the service running behind the open port. These are referenced by their CVE ID, which can be used to search the CVE database for more information on the particular vulnerability.
- Details: describes the form of attack that the exposed port is vulnerable to.
Endpoint Protection
What is Endpoint Protection?
Endpoint Protection, often referred to as 'Antivirus' or 'Internet Security', is the most recognisable technology in the cyber security stack. Essential to detecting and preventing suspicious and malicious activity on devices, Endpoint Protection is becoming evermore sophisticated. From behavioural analysis to artificial intelligence, cloud scanning to SOC-backed EDR (aka MDR) and everything in-between, this technology is absolutely essential to protecting your organisation from cyber-attack.
Understanding your Tool's Data:
Clicking into your Endpoint Protection tool will provide you with an overview of the tool's data.
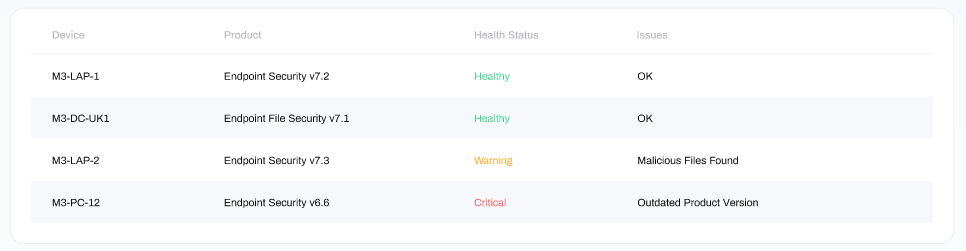
In this window there are four columns, displaying from left to right:
Device: the name of the device
Product: the name and version of the endpoint protection product on the device
Health Status: the health of the endpoint protection on the device. Options include Healthy, Warning and Critical, and are colour coded
Issues: any known issues with the endpoint protection product on the device
SIEM/IDS
What is SIEM & IDS?
Security Information & Event Management (SIEM) is a technology that provides real-time collection and analysis of event and log data from numerous sources (such as routers, firewalls, switches, wireless access points, servers, workstations, cloud services etc.). This data is analysed for patterns, correlations, Indicators of Compromise (IoCs), triggers, augmented with actionable threat intelligence, then alerts you to an activity which requires your attention. A SIEM backed by a Security Operations Centre (SOC) and/or supplemented with Artificial Intelligence (AI) can also take preventative action if there is high confidence in the legitimacy or confidence of the identified events. SIEM's are often combined with Intrusion Detection Systems (IDS), which capture raw network traffic and ingest this data to the SIEM tool, to enhance the detection (and logging) of suspicious and malicious activity both internally and externally.
Understanding your Tool's Data:
Clicking into your SIEM/IDS tool will provide you with an overview of the tool's data.
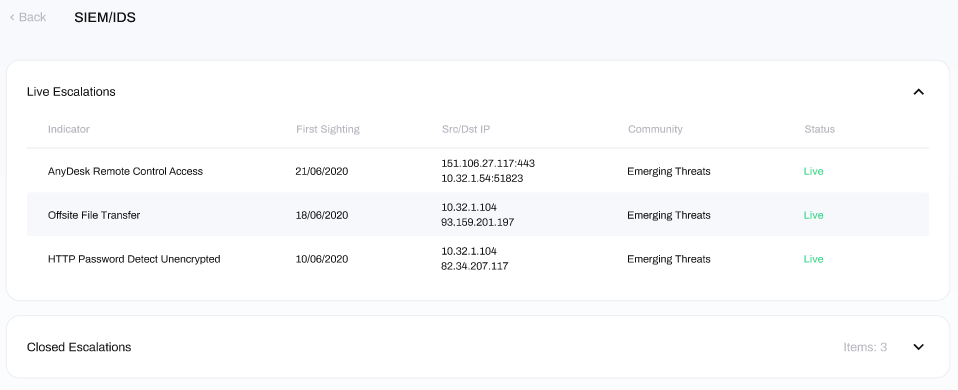
At the top of this window is a section for Live Escalations there are five columns, displaying from left to right:
- Indicator: describes the type of activity that the tool has detected as suspicious or malicious.
- First Sighting: when the issue was first discovered in the environment.
- Src/Dst IP: The source and destination IP addresses of where the detected activity was communicating with.
- Community: the name of the threat intelligence community with detection rules which was triggered to identify this activity.
- Status: indicates whether the escalation is live (ongoing) or closed
At the bottom of the window you can also see Closed Escalations, which lists previous escalations which have been analysed and marked as resolved.
Dark Web Monitoring
What is the dark web?
The Dark Web is a hidden universe contained within the “Deep Web”- a sublayer of the Internet that is hidden from conventional search engines. Search engines like Google, BING and Yahoo only search 0.04% of the indexed or “surface” Internet. The other 99.96% of the Web consists of databases, private academic and government networks, and the Dark Web. The Dark Web is estimated at 550 times larger than the surface Web and growing. Because you can operate anonymously, the Dark Web holds a wealth of stolen data and illegal activity.
Dark Web Monitoring enabled you to monitor the Dark Web for exposure of your organisations information - specifically usernames, passwords, IP addresses and Personally Identifiable Information (PII). Your information provides a very lucrative business opportunity for cybercriminals. This information is used to conduct further criminal activity, such as data breaches of sensitive corporate information, social engineering as well as identity theft of individual employees or targeted cyber-attacks on your organisation. With just a few key personal details and basic technological skills, these criminals could potentially gain access to some of your most important accounts.
Understanding your Tool's Data:
Clicking into your Dark Web Monitoring tool will provide you with an overview of the tool's data.
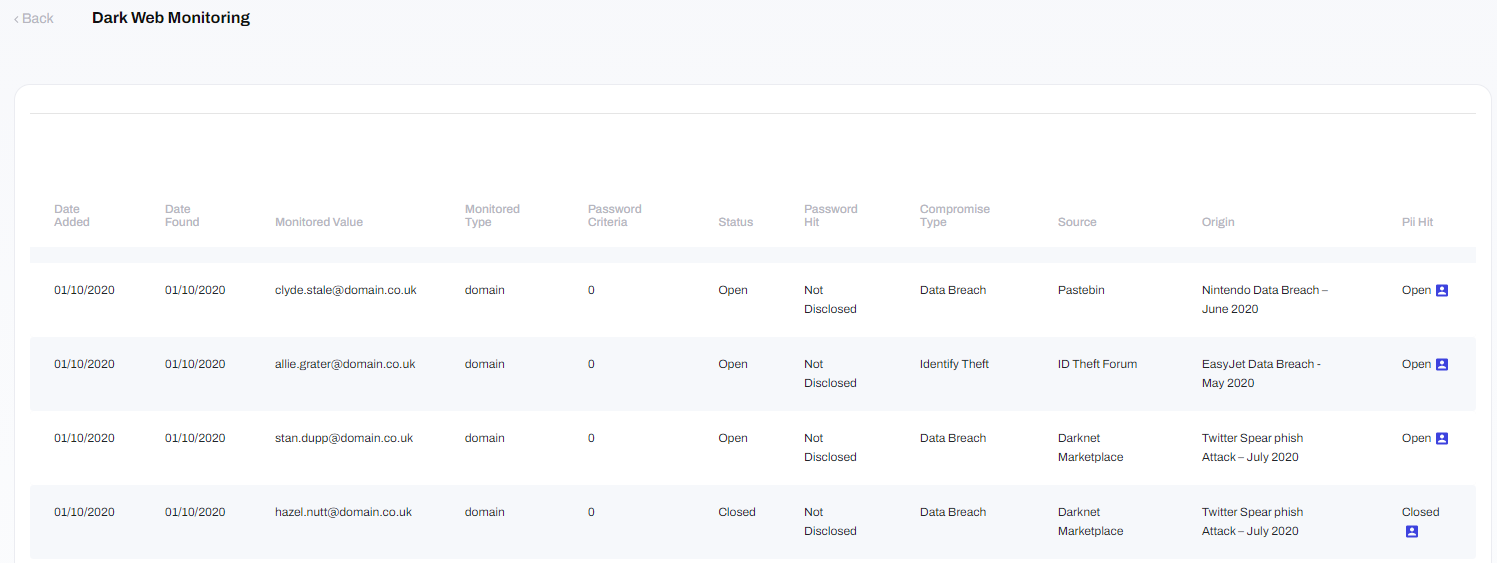
Data displayed includes:
- Date Added: this is the date that the compromised credentials were added to the dark web.
- Date Found: this is the date that the compromised credentials were discovered by the monitoring tool.
- Monitored Value: this is the email address that has been compromised.
- Password Criteria: this column is reserved for future use
-
Password Hit:this is the password that has been leaked. Leaked passwords may be visible in various forms:
- Plaintext: the unmodified, readable password in its original form.
- Hash: an unreadable form of the password resulting from a hashing/encryption algorithm.
- Not Disclosed: the type of password hit is unknown.
- Compromise Type: this is the type of attack that was used to steal the credentials prior to their appearance on the dark web.
- Source: this is the location within the dark web where the compromise was located. This is often unknown to protect anonymity of the discloser.
- Origin: this is the specific website that the compromised credentials were stolen from.
- PII Hit: this is whether Personally Identifiable Information (PII) was also leaked as part of the compromise. As the name suggests, PII is information that could identify the owner of the credentials such as first name, surname, address and age.
Website Scan
What is a Website Scan?
Website Scans are a vulnerability assessment against your organisations internet facing website(s) to detect any exploitable vulnerabilities over the internet. Organisations are often targeted not only to deface and embarrass the business, but also as a supply-chain attack in order to target visitors of the website who are the intended target (for example, a supplier to local government or global corporation who have fortified their external defences).
Understanding your Tool's Data:
Clicking into the Website Scan tool will provide you with an overview of the tool's data.
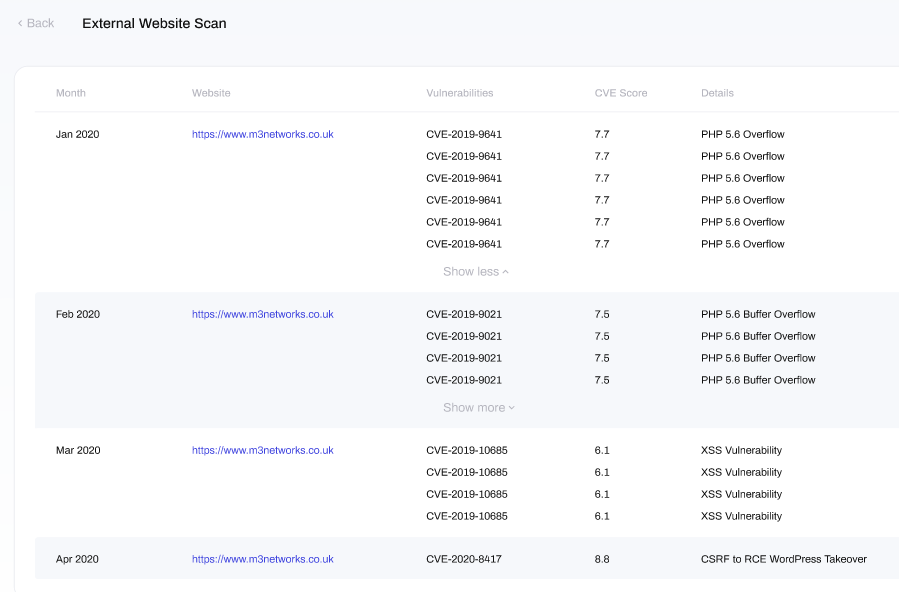
In this window, you will find a breakdown of results from pervious scans, detailed in the following columns:
- Month: the month the scan was run
- Website: the URL of the website being scanned
- Vulnerabilities: the list of vulnerabilities discovered. These are referenced by their CVE ID's, which can be used to search the CVE database for further details.
- CVE Score: the CVE score of the vulnerability, which rates its severity (ranging from 0 to 10) based upon a number of metrics.
- Details: describes the form of attack that the vulnerability is linked with.
Incident Response
What is Incident Response:
Incident Response is essential to every organisations cyber security defences, and is the last line of defense (or picking up the pieces) of a cyber-attack. Whether actual or suspected, employees should be encouraged to report any signs of a security incident, enabling Incident Triage to take place to determine whether the reported Incident is real simply a False Alarm. Oftentimes, a bad actor (aka hacker) will compromise an organisations systems then sit quietly undetected, monitoring and probing the environment for an opportunity to move laterally or escalate it's privileges to a point where it can execute with maximum effect. This is why diligent Incident Response is so critical to an organisations defences, as many cyber-attacks could be prevented if any and all reports, whether from users or tools, are responded to consistently and meticulously.
Understanding your Tool's Data:
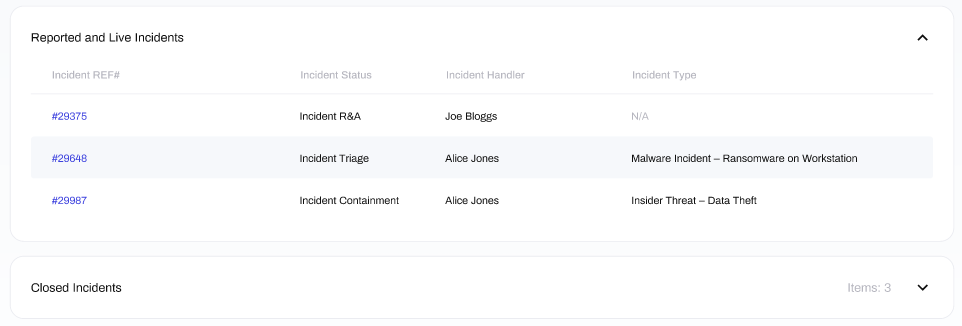
From the Technical Drilldown module, if you click into Incident Response, you will see a section titled Reported and Live incidents at the top of the window. Within this section, there are the following columns:
Incident REF#: the reference number of the incident.
Incident Status: the current stage of incident response.
Incident Handler: the incident response handler who is managing the incident.
Incident Type: the category of the cyber-security incident, such as 'Malware Incident' or 'Internal Threat'
At the bottom of the window you can also see Closed Incidents, which lists previous incidents that have now been resolved.
How do I Report an Incident?
Incidents are automatically generated in the Incident Response module when the HighGround algorithms detect that a potential Incident has occurred. Alternatively you can create your own incident which will be submitted to VIROC (Vision Incident Response Operations Centre).
To do so, click on Incident Response from the Technical Drilldown module, and then the New Incident button located at the top-right of the window:

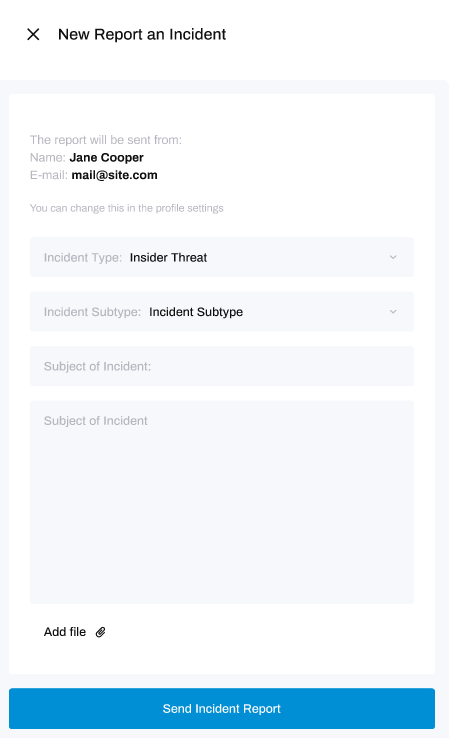
When you click 'Send Incident Report', your report will be sent to the HighGround Incident Response team who will be in contact with you promptly.
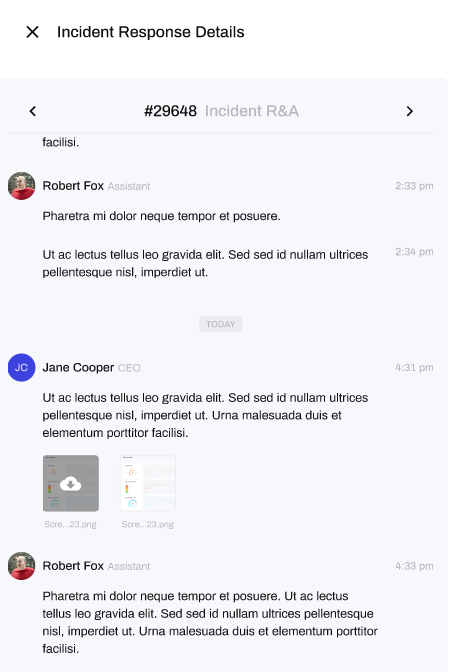
How do I Track my Incidents Progress?:
If you have reported an incident to the Vision Incident Response Operations Centre (VIROC), you can track your incident by clicking on the Incident Reference number. This will open a new window where you can see comments from the HighGround Incident Response Handler and communicate with them on your Incident.
Technical Drilldown Status
Technical Drilldown Status' appear next to each technology:
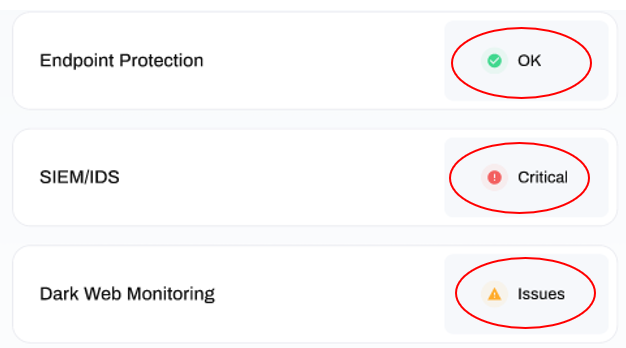
These status' provide indicators on the health of the tool's data, as well as how much impact the tool is having on your CyberScore and CyberThreat level KPI's.
There are three variations of status:

This status indicates that the tool's data does not suggest there are any current issues in the area of Cyber Security measured by the tool. As a result, your CyberScore and CyberThreat level are not being negatively impacted.
- For example; the Website Scan tool has found no vulnerabilities in its latest scan, so this is not negatively impacting your CyberScore and CyberThreal Level.
This status indicates that the tool's data suggests there are some problems in the area of Cyber Security measured by the tool. As a result, this is having a moderately negative impact on your CyberScore and CyberThreat level.
- For example; the Patch Management tool has identified a few of your organisation's devices that contain outdated software, so this is having a moderately negative impact on your CyberScore and CyberThreat Level
This status indicates that the tool's data suggests there are some serious problems in the area of Cyber Security measured by the tool. As a result, this is having serious negative impact on CyberScore and CyberThreat level.
-
For example; the External Network Scan tool has identified numerous vulnerabilities, so this is having a serious negative impact on your CyberScore and CyberThreal Level